Capital Market Line (CML): Definition & Formula
Updated on February 6, 2023 | 4 min. read🌟 KEY TAKEAWAYS
The capital market line is a graphical representation of the relationship between risk and return.
The CML shows the expected ROI as a function of its beta.
The CML is used to evaluate investments and determine ROI.
The CML is a model and real-world conditions may not always reflect the model.
The CML is a good entry-level investment analysis.
An effective strategy is using the capital market line (CML). But what exactly is this financial metric and how does it work? Read on to learn everything you need to know. We’ll explore the formula, how it works, why it’s important and much more!
What Is the Capital Market Line (CML)?
The capital market line (CML) is a straight line that shows the relationship between risk and return of different portfolios. The CML is according to the assumption that all investors are rational and seek to maximize their returns.
The CML works to plot expected return of an investment against its risk. The CML is according to the capital asset pricing model (CAPM). This states an expected return of an investment is equal to the risk-free rate plus a risk premium.
The CML helps find the best portfolio, which is the portfolio that provides the highest expected return for a given level of risk.
CML helps investors plot an expected return of an investment against its risk. The CML serves to find the optimal portfolio, which is the portfolio that provides the highest expected return for a given level of risk.


Capital Market Line Formula
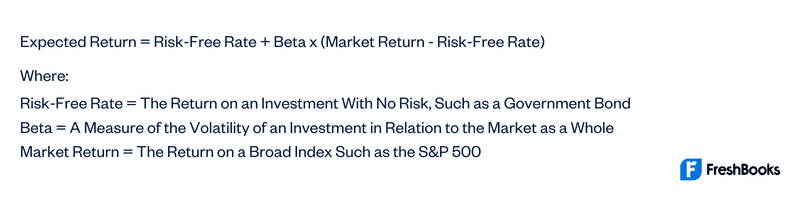
The formula for the CML is:
The CML can find the optimal portfolio, which is the portfolio that provides the highest expected return for a given level of risk.
To find the optimal portfolio, investors need to find the portfolio that lies on the CML and has the highest expected return for a given level of risk.
The CML is a theoretical tool and does not necessarily reflect actual market conditions.
The CML is according to the assumption that all investors are rational and seek to maximize their returns. This may not always be the case in reality.
The CML is just one tool that investors can use to find the optimal portfolio. There are many other factors to consider when choosing an investment. So talk to an investment manager to ensure you make the right decision.
How does a Capital Market Line (CML) Work?
The Capital Market Line (CML) is a graphical representation of a risk and return relationship for assets in the capital market. The CML is used by investors to identify the optimal portfolio, which is the portfolio that provides the highest return for a given level of risk.
The CML can calculate an expected return of a portfolio. It does this by substituting the values for the risk-free rate, beta, and expected market return.
The CML can also be used to calculate the beta of a security. Beta measures volatility, or risk, of a security in relation to the market. A security with a 1 beta has equal market volatility, while a security with a 2 beta has twice the market volatility. A security with 0.5 beta has only half market volatility.


Why Is the Capital Market Line Important?
The CML is important because it can find the optimal portfolio. The optimal portfolio is the portfolio that provides the highest expected return for a given level of risk.
The CML is also important because it is according to the capital asset pricing model (CAPM). Thus, it is a widely used model for pricing individual assets.
The CML is just one tool that investors can use to find the optimal portfolio. There are many other factors to consider when choosing an investment. From rates of return to standard deviation, you have a lot to think about.
You also want to differentiate between risky assets and risk-free assets. If necessary, speak to asset managers for guidance.
Example of the Capital Market Line
Suppose an investor is considering two different investments, Stock A and Stock B. Stock A has an expected return of 10% and a beta of 1.5. Stock B has an expected return of 12% and a beta of 2.0.
The CML can compare expected return and risk of these two stocks.
The assumed risk-free rate is 4%. The assumed market return is 8%.
Using the formula for the CML, we can calculate expected return for each stock:
Expected return for Stock A = Risk-free rate + Beta x (Market return - Risk-free rate)
= 4% + 1.5 x (8% - 4%)
= 10%
Expected return for Stock B = Risk-free rate + Beta x (Market return - Risk-free rate)
= 4% + 2.0 x (8% - 4%)
= 12%
As we can see, Stock A has a lower expected return and a lower beta than Stock B. This means that Stock A is less risky than Stock B.
CML helps investors find their optimal portfolio. In this example, the optimal portfolio would be a portfolio that is equally weighted in Stock A and Stock B.
Capital Market Line Limitations
The CML is a theoretical tool and does not necessarily reflect actual market conditions.
The CML is according to the assumption that all investors are rational and seek to maximize their returns. This may not always be the case in reality.
The CML is just one tool that investors can use to find the optimal portfolio. There are many other factors to consider when choosing an investment.
Summary
CML is an effective tool for evaluating investments and determining the required return on an investment. It is important to remember that the CML is a model and that real-world conditions may not always reflect the model. However, the CML provides a good starting point for investment analysis.


Capital Market Line FAQs


