Price-to-Sales Ratio (P/S) Definition, Formula & Example
Updated on February 24, 2023 | 6 min. read🌟 KEY TAKEAWAYS
Price-to-sales (P/S) ratio is a measure of how much investors are paying for each dollar of a company's sales.
The P/S ratio can be used to identify overvalued and undervalued stocks.
Enterprise value-to-sales (EV/Sales) is another ratio that investors use to measure a company's stock value.
It is important to remember that no one metric is perfect. You should use multiple ratios to get a complete picture of a company before investing.
When it comes to investing, it’s important to understand different financial metrics. Keep reading our guide to price-to-sales (P/S) ratio to learn what it is, how to calculate it, and more.
What Is the Price-to-Sales Ratio?
The price-to-sales (P/S) ratio is a specific valuation that you can use to compare a company’s stock prices against its revenue. It’s a useful indicator that helps determine the value that a financial market places on each dollar. And, it’s one of the key tools that investors and analysts use for valuation and overall analysis.
To determine the P/S ratio, you can do it in one of two different ways:
- Divide the market capitalization of the company by its total sales over a specific period. This is usually 12-month revenue.
- Divide the stock price by the overall sales per share, which is on a per-share basis
The P/S ratio is also commonly referred to as a revenue multiple or a sales multiple. It’s worth noting that to get the most effective and accurate information, the ratio is most relevant when comparing companies in the same sector.
Having a lower ratio might mean that a specific stock is undervalued. While having a ratio that’s much higher than average could indicate that it’s an overvaluation.
When you’re considering what the typical twelve-month period is for sales, it’s usually the previous four quarters. This could also get referred to as 12-month trailing revenue, or the trailing 12 months (TTM).
Or, it could also be the most current or recent fiscal year (FY). Having a P/S ratio that’s focused on forecasted sales for the current year is known as a forward P/S ratio.


The Formula for Calculating the P/S Ratio
The good news is that it’s fairly straightforward to calculate the P/S ratio. All you need to do is divide your current stock price by the sales per share. To find the current stock price, you can check out almost any major finance website and search for the stock symbol.
To find out the sales per share metric, you calculate it by dividing the total amount of a company’s sales by outstanding shares.
The formula for calculating the P/S ratio would look like this:
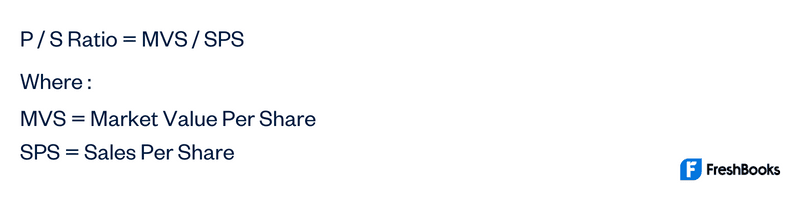
It’s important to consider that the P/S ratio doesn’t take into account if a specific company makes any earnings. It also doesn’t consider if the company might make earnings in the future. As well, it can be a challenge to compare companies that aren’t in the same industry.
This is since different companies can have different capabilities. For example, a video game company is going to have different strategies to turn sales into profits compared to a grocery retailer.
Plus, P/S ratios aren’t going to account for any debt loads or consider the status of a specific company’s balance sheet. If a company has almost no debt, they’re going to be more attractive compared to a leveraged company with a similar P/S ratio.
Example of the Price-to-Sales (P/S) Ratio
Let’s say that you wanted to use the P/S ratio to find more information about a company. After doing a little due diligence, you have found the following information for a 3-year period:
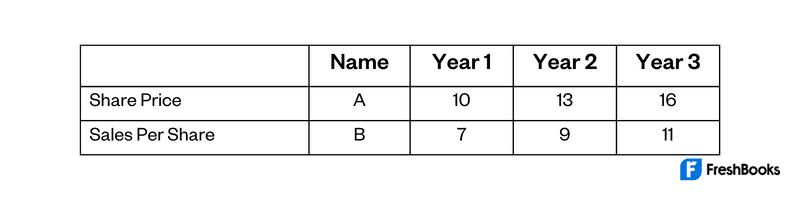
Now that you have this information, you can use the formula outlined above to divide the market value per share by the sales per share. You would then end up with a P/S that would look this like:
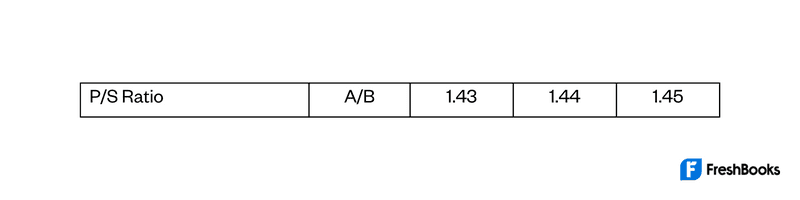
You can see that the share price grew by about 60% over those three years, but the sales per share increased a little slower. And by looking closer at the P/S ratio you can see that, while only a slight increase, investors are now paying more for the shares compared to in the first year.
It’s important to remember that there can be different factors that increase the P/S ratio. These can be investor speculation, changes in market trends, or an increase in market share.
Why Is the P/S Ratio Useful to Investors?
There are a few reasons why the P/S ratio is so popular with investors:
- It's a simple calculation that can be used to compare companies within an industry or to measure how a particular stock is performing
- It's one of the most common ratios used to value an investment
- The P/S ratio can be used to identify overvalued and undervalued stocks
What Are the Limitations of the Price-to-Sales (P/S) Ratio?
P/S ratios can vary depending on the industry. For example, technology companies tend to have a higher P/S ratio than utility companies. This is because technology companies are growing at a faster rate and tend to have more volatile stock prices. In this case, it's important to consider industry averages when using the P/S ratio.
Another limitation of the P/S ratio is that it doesn't take into account a company's debt. A company with a lot of debt may have a favorable P/S ratio. It may not be a good investment depending on the amount of debt that the company carries.


Comparing Other Important Metrics
There are numerous metrics an investor can use to evaluate a stock or company. Here are some other common examples and how they compare to P/S.
Price-to-Earnings Ratio (P/E)
The price earnings ratio compares the price of the stock with its earnings (net income) from the last twelve months (LTM). It is one of the most famous fundamental ratios.
CAPE, Cyclically Adjusted Price-to-Earnings (P/E10)
P/E10 is similar to P/E. It uses the average earnings from the last 10 years. This gives a more complete picture of a company's earnings throughout highs and lows. It is also known as the Shiller P/E ratio.
Price-to-Book (P/B) Ratio
The P/B ratio compares the price of the stock with its book value. Book value is total assets minus total liabilities. It is commonly used in the banking industry.
Good investment software can offer a variety of uses including:
- Historical stock prices
- Stock charts
- Fundamental data
- Technical analysis indicators
- And more
Summary
The PS ratio is a valuation that investors and analysts can use to compare the stock prices of a company with its revenue. It helps to determine how much value a specific financial market has on the dollars that are earned. There are typically two ways to determine the P/S ratio.
The first is by dividing market capitalization by total sales over a period of time, which is usually twelve months. The other is by dividing the stock price by the overall sales per share. You can get a better sense of things like profit margins, share price, shares outstanding, and debt load. It's a great valuation tool.
It’s also worth noting again that the P/S ratio works best when comparing companies in the same sector or industry. This will help provide the most accurate and up-to-date information for analysis and help gain a competitive advantage.


Frequently Asked Questions


