How to Read a Financial Report: An Extensive Guide

A huge part of business success comes down to one thing: Your ability to understand your finances. If you can’t make sense of your financial statements, you’ll be in the dark about your company’s financial health.
Before you despair, you don’t need a business degree from Harvard to understand your company’s financial position. When asked about the personal characteristics a person should possess in order to become a successful entrepreneur, billionaire Mark Cuban answered: “Willingness to learn, to be able to focus, to absorb information.”
With that in mind, in this article, we explain how to read the 3 basic financial statements that are important in any business.
Here’s what we’ll cover:
How to Read an Income Statement
How to Read a Cash Flow Statement
Reading Financial Statements Is Easier with Accounting Software
Note: FreshBooks Support team members are not certified income tax or accounting professionals and cannot provide advice in these areas, outside of supporting questions about FreshBooks. If you need income tax advice, please contact an accountant in your area.

How to Read an Income Statement
If you’re in business because you want to make a profit, you’ll want to know how to read an income statement. Why? Because an income statement is a financial statement that indicates your company’s profitability.
By reading it, you learn whether, during a specific reporting period, your company has made a profit or has a loss, as well as exactly how much profit and loss. That’s the reason an income statement is also called a profit and loss report.
While income statements come in different formats and shapes, they will most often look something like this:
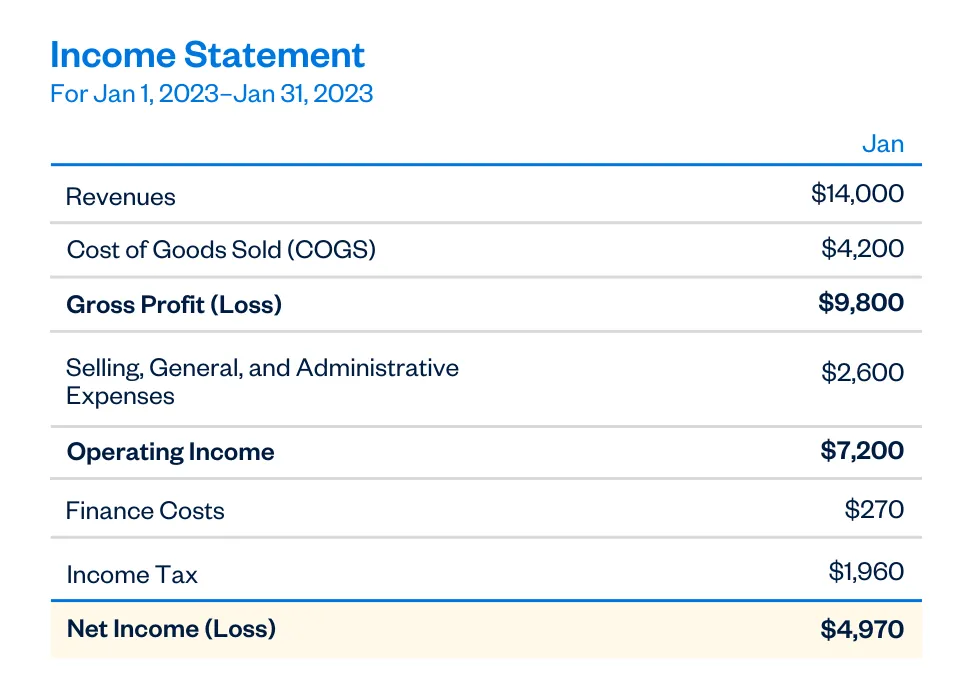
Parts of an Income Statement
The following are some of the basic income statement elements:
- Revenues/Sales: This is the total amount you received from selling your goods or services.
- Cost of Goods Sold (COGS)/Cost of Sales: These are the direct costs you incur for selling a product. For example, if you’re selling jewelry, it’s the cost of the making or acquiring the jewelry that you sold.
- Gross profit: Your gross profit is your total revenue, minus the cost of goods sold. It’s your total potential profit, before other expenses.
- Selling, Administrative, and General (SG&A) Expenses: These are expenses that are not COGS. These include marketing costs, legal expenses, or management and administrative staff salaries. In many cases, these are the costs you have the most control over. They may be called general expenses or operating expenses.
- Operating Income: This is your income after subtracting your operating expenses.
- Finance Costs: These are typically interest paid on borrowed loans and may also be called interest expenses.
- Income Tax: Generally, this appears just before the bottom line. You may also see a subtotal for income before tax.
- Net Income (or loss): Known as the “bottom line,” this is your actual profit (or loss) for the time period.
There are two ways of reading your company’s income statement: the vertical method and the horizontal method.
How to Analyze Income Statements Vertically
As the name suggests, a vertical analysis entails ordering your income statement from top to bottom and looking at the items, or groups of items, individually.
For even more granular feedback, some small business owners choose not to group their expenses. Instead, they list the line items individually and add a column for percentages.
Usually, revenue is used as the basis for calculating percentages. COGS, for instance, will have two columns: One for the financial value of the COGS and another that shows the cost of goods sold as a percentage of sales revenue.
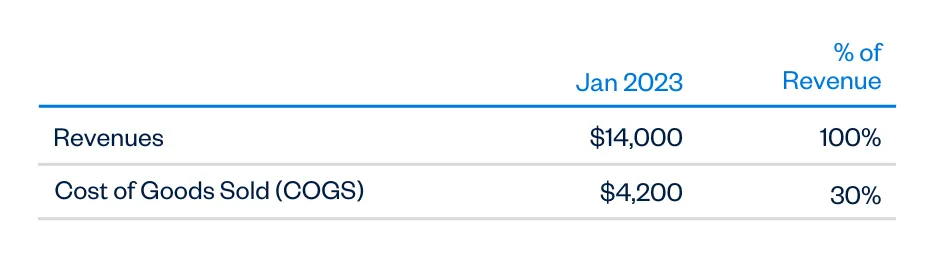
This analysis will continue all the way down the income statement until you reach the bottom line, which is net income.
Now, here’s the intriguing part. Which figures should you pay attention to?
There are 3 margins that you’ll want to look for—all calculated as a percentage of revenue:
- Gross profit margin is what you have left after you’ve accounted for your direct costs or cost of goods sold/cost of sales. The gross profit margin formula is:

- Operating profit margin includes operating expenses in your calculation and shows how efficiently your business allocates its resources. The operating profit margin formula is:

- Net profit margin is your remaining income after all operating expenses, taxes, interest expenses, and other deductions. Calculate net profit margin by:

So, once you do the math, what does it mean? Suppose you find your net profit margin is 11%. How do you know whether this is a good performance?
Compare all your percentages with industry averages. (Keep in mind that your business location may affect some of these figures. You can’t compare office rent in Greensboro, North Carolina, with Midtown Manhattan.)
As a reference point, industry averages in the United States as of January 2022 for gross profit margin and net profit margin were 38.44% and 9.84%, respectively.
How to Analyze Income Statements Horizontally
While vertical analysis has its place, a horizontal analysis may even be more meaningful.
Horizontal analysis is where you’ll have columns for several preceding years (sometimes up to 4 years), in addition to the current year’s income statement. You may have additional columns for absolute change and percentage change calculations.
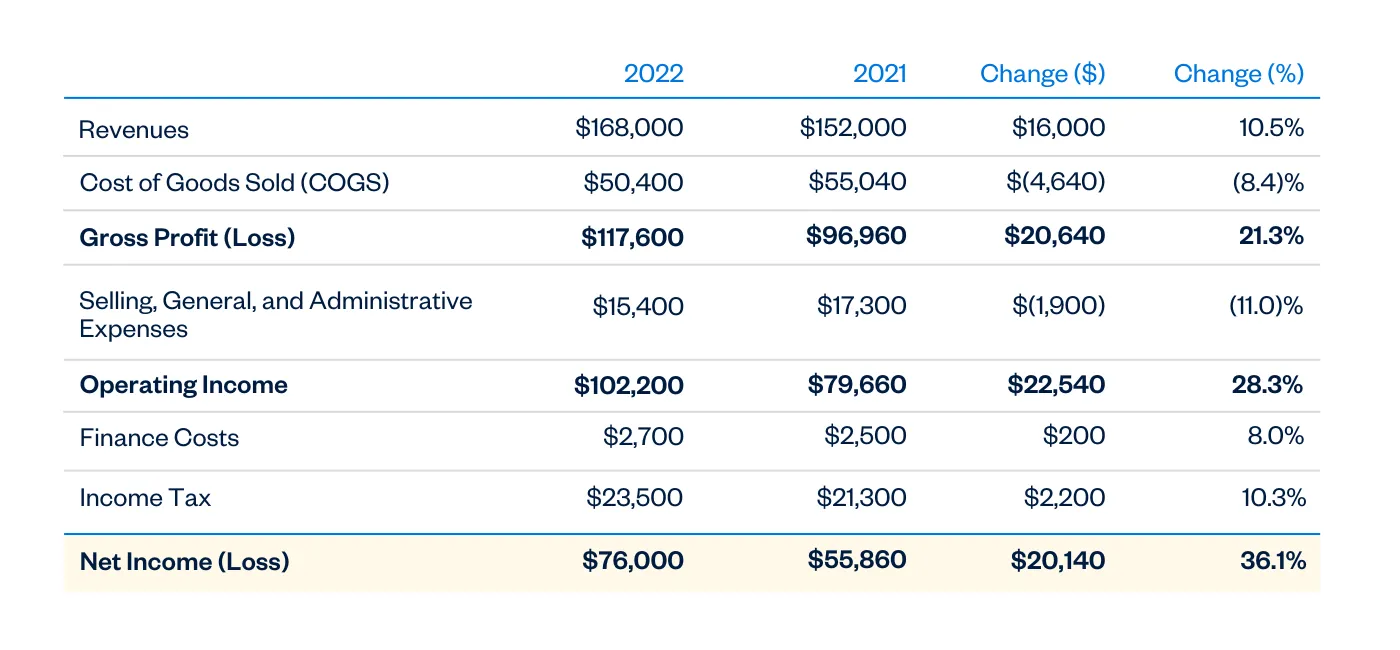
This presentation type is usually called a comparative income statement since you’re comparing multiple years.
The reason horizontal analysis is crucial is that it reveals trends for income statement line items. For instance, you can easily see if your sales are growing or declining year over year. The same applies to your margins.
Because of this insight, you’ll be able to see the forest instead of the trees and make strategic decisions regarding your business.
How to Read a Balance Sheet
For valuation, a balance sheet is the most important financial statement. It’s also called a statement of financial position.
A balance sheet shows what your business is worth (its value) by quantifying your assets, liabilities, and equity. Your balance sheet should always balance, meaning assets should always equal liabilities plus equity.
Parts of a Balance Sheet
In most cases, a balance sheet will look something like this:
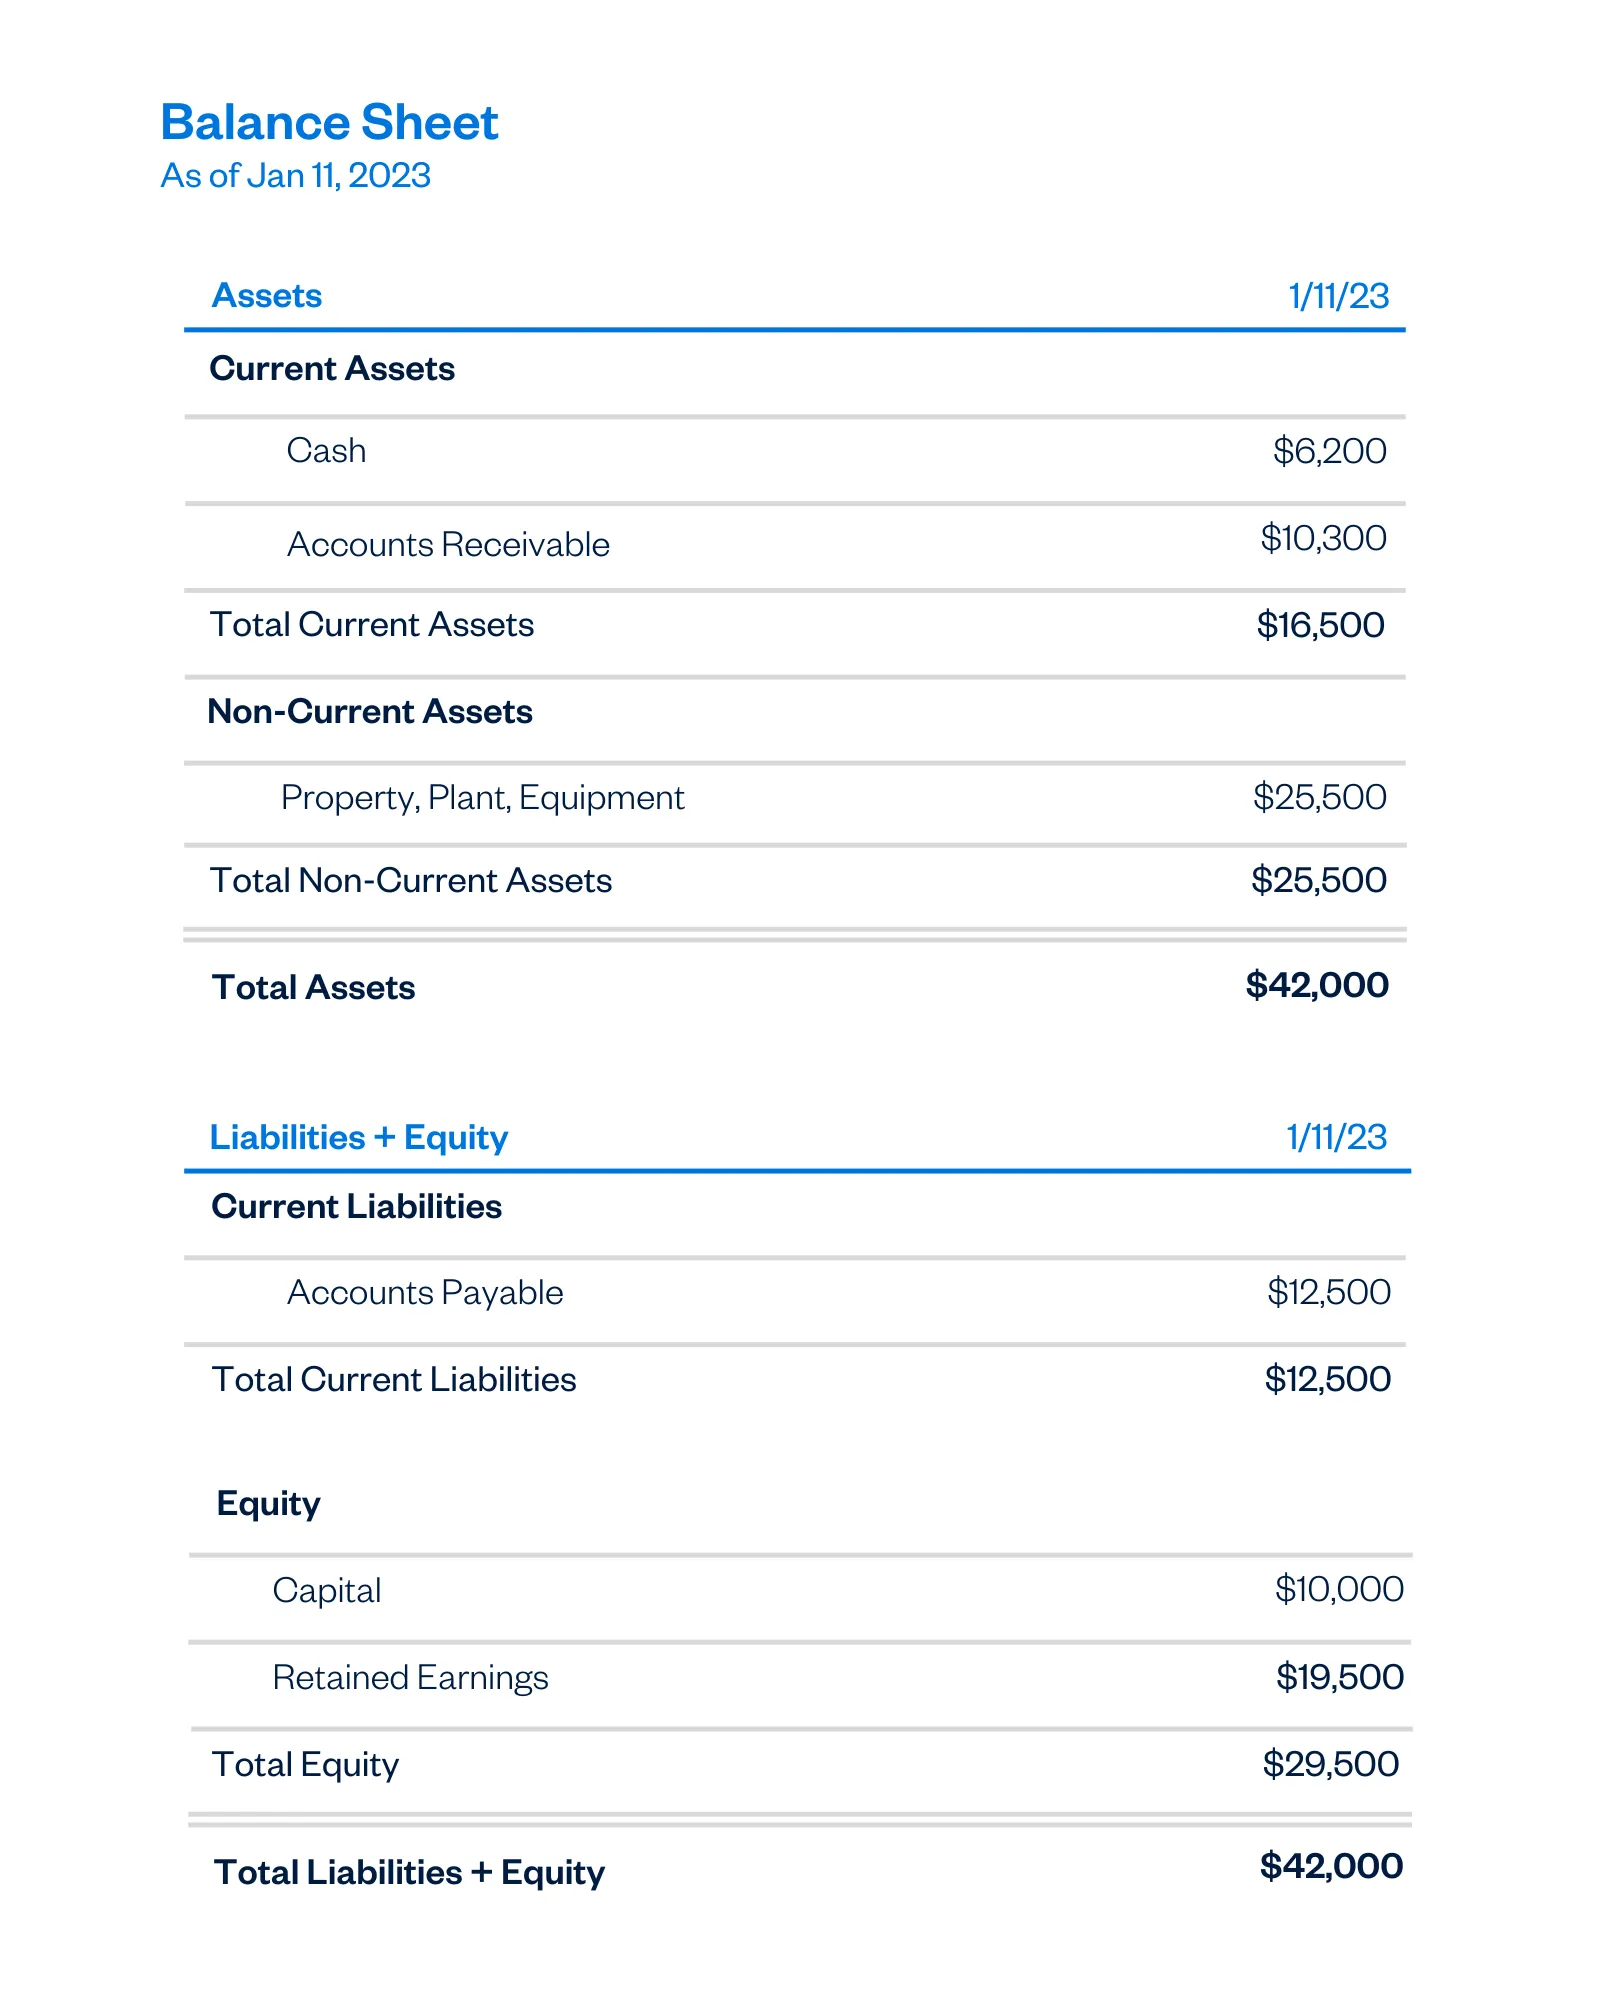
The following is a quick overview of the balance sheet elements:
- Current assets: Cash or cash equivalents, or business resources that can be converted to cash within 12 months.
- Non-current assets: Things your company owns that can’t be converted to cash within the next 12 months.
- Current liabilities: These are the financial obligations you intend to settle within the next 12 months.
- Non-current liabilities: These are debts your company owes that you don’t intend to settle within 12 months.
- Capital: Also known as owner’s equity or shareholders’ equity, this is the money invested by the owners.
- Retained earnings: These are the cumulative earnings (profits or losses) of your business since it began operations, including the current year’s earnings.
4 Important Balance Sheet Metrics
How can you make sense of your balance sheet and turn a mere piece of paper into informational dynamite?
These are the metrics you should laser in on.
1. Net worth
A balance sheet is essentially a statement of value. The balance sheet figure that will most accurately reveal your business value, albeit imperfectly, is your equity.
A good way to see the rate at which your net worth has been increasing or decreasing is to plot your equity over time on a graph.
2. Liquidity
Liquidity is a measure of your ability to meet your short-term financial needs. Forget about lack of market or stiff competition; running out of cash is the number one reason startups fail.
You can calculate your liquidity by assessing your current ratio:

As a rule of thumb, this ratio should stay above 1.
3. Solvency
While liquidity is your ability to meet your short-term financial obligations, solvency is your ability to meet your long-term financial obligations. You can do this by assessing your debt-to-equity ratio:

A situation where your debts are equal to, or more than, your total equity is a definite red flag unless you’re in the startup phase and building a company.
Your capital structure will also be key. You don’t want a situation where your debt is more than your equity. These companies are highly leveraged. And high business leverage could make meeting your obligations difficult.
4. Closing Inventory Metrics
High or increasing levels of closing inventory might show that you’re struggling to sell your products. A good metric here is the day sales of inventory:

This shows the number of days it takes before you sell your products. You should monitor this figure over time and pick out its trend.
How to Read a Cash Flow Statement
Net income is important. Total equity is important. But in business, cash flow is still king.
Interestingly, your net income figures have no relation to your cash figures.
This is because most businesses use accrual-basis accounting. This means that sales and expenses are recorded not when cash changes hands, but when a contract is consummated.
For instance, income is recorded as an accounts receivable transaction when you invoice for it, instead of when your client actually pays you. Likewise, you would record an expense at the time of purchase and not when you pay your credit card bill.
That’s the reason a cash flow statement is an extremely vital member of your financial statements.
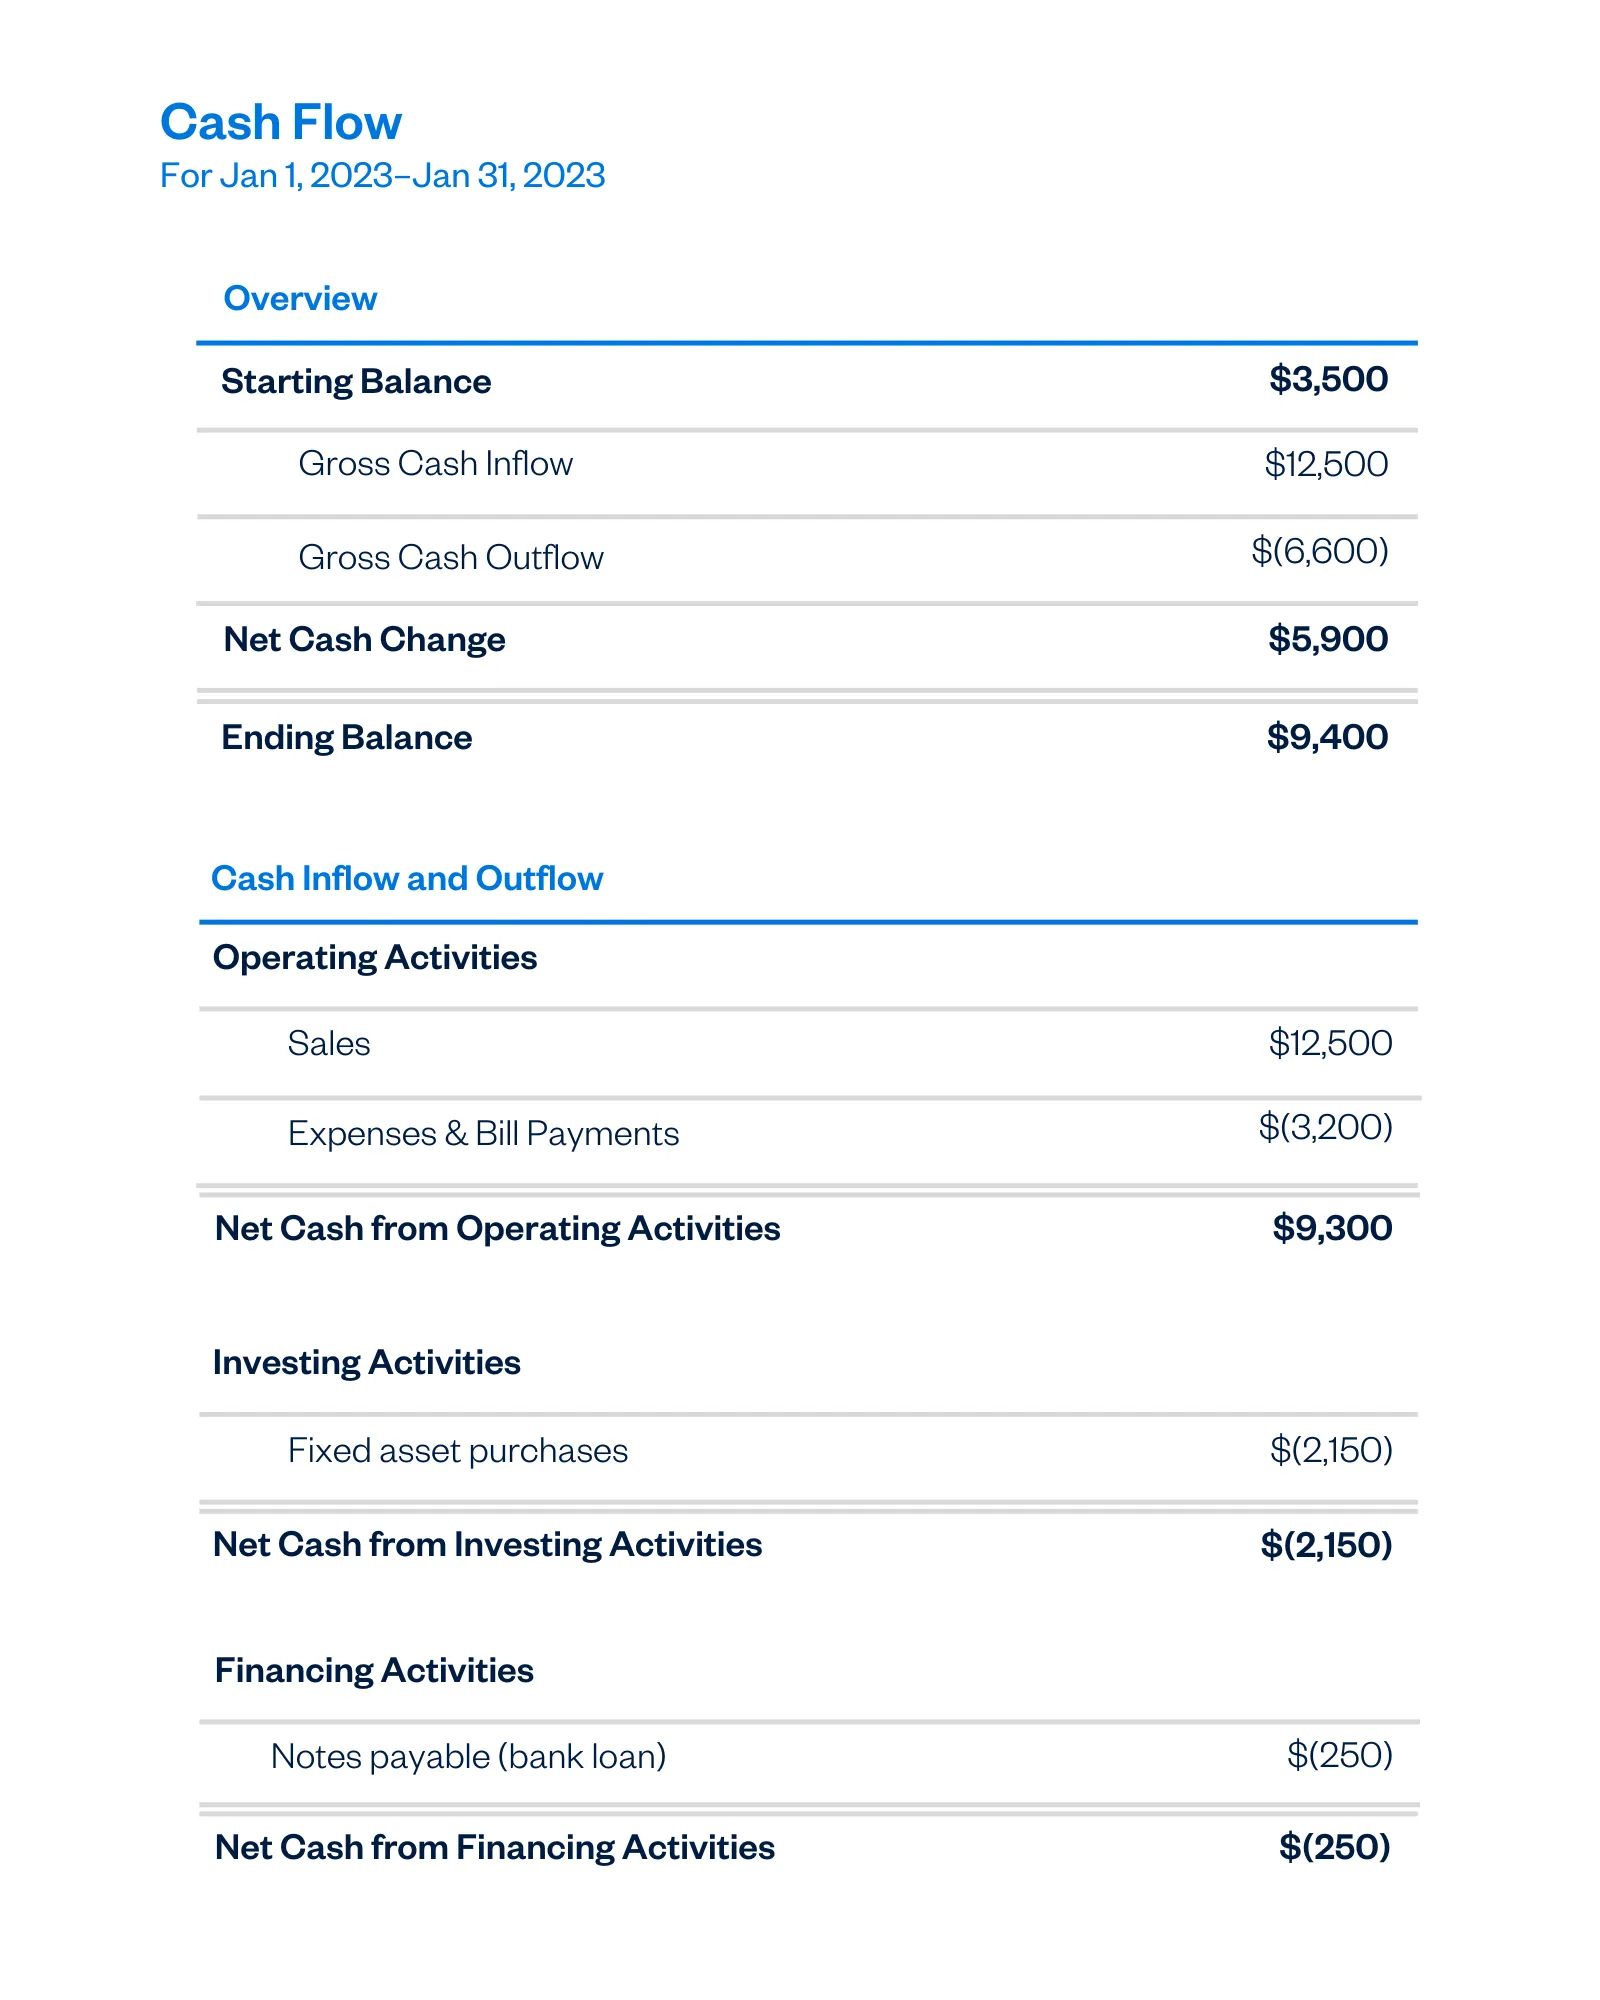
Parts of a Cash Flow Statement
A cash flow statement shows the movement of cash—the cash inflows and outflows within the business—and will contain these 3 sections:
- Cash Flows From Operations (or from operating activities)
- Cash Flows From Investing Activities
- Cash Flows From Financing Activities
Let’s take a look at what each type of cash flow tells you about your company’s financial performance.
Cash from Operating Activities
This is cash generated from your day-to-day trading activities. Since operating activities are the mainstay of a business, a business whose cash primarily comes from operations will be a more sustainable one.
Of course, a few periods where cash from operating activities dwindle should not be cause for alarm. The problem will be if the trend persists. It shows that your business is not generating enough cash from its day-to-day trading activities.
Keep an eye on increases in accounts receivable, too. Significant increases here may warrant a look at your day sales outstanding ratio and could mean that your debt collection strategy needs to be recalibrated.
Cash from Investing Activities
This is cash used or obtained from the sale or purchase of capital assets, mainly buildings, property, and equipment.
Significant levels of cash used in investing activities in a particular year, or over a period of time, may mean your business is expanding.
Cash from Financing Activities
This is cash that relates to debt acquisition or repayment. A business that increasingly relies on cash from financing activities, or whose cash from financing activities is on the rise, may be experiencing challenges in generating revenue.

Reading Financial Statements Is Easier With Accounting Software
As a small business owner, you can’t put interpreting your financial reports on the back burner or delegate it entirely to professionals. Recognizing trends in your financial reporting and acting accordingly can make or break your business.
That said, creating financial statements doesn’t have to be a chore. FreshBooks automatically generates accounting reports for your business, so you always have the information you (and your accountant, lenders, or investors) need at your fingertips. It handles your invoicing and expenses, too, and can connect directly with your bank, so your numbers are always current, and reporting is accurate.
RELATED ARTICLES
 How to Make an Expense Report: 6 Easy Steps
 How to Prepare Annual Report for Your Small Business
 How to Report Sales Tax: Tax Reporting for Small Businesses
 How to Measure Business Performance in 3 Steps
 How to Prepare a Trial Balance in 5 Steps
 What Is a Trial Balance Report?